F1 - Smart Irrigation
Algorithm / Method
RandomForest & HistGradientBoosting
Dataset / Scope
31 Years of Udawalawe Hydrology Data
Performance Metric
0.71 MCM Inflow RMSE
Field Impact
20-35% water savings vs static scheduler
An integrated decision-support system for Sri Lankan irrigation schemes, combining IoT telemetry, remote-sensing crop health, rainfall forecasting, and resource-constrained agricultural optimization.
11,687
Udawalawe daily records
10m
Sentinel-2 analysis scale
71,737
Retail price observations
1-14
Day forecast horizon
ASICOP replaces manual, static schedules and isolated agricultural tools with an end-to-end integrated solution. Here is how we resolve key domain inefficiencies:
Traditional flood irrigation is applied on fixed 7-10 day schedules or on manual observation, ignoring weather forecasts and leading to estimated water losses of 35-50%.
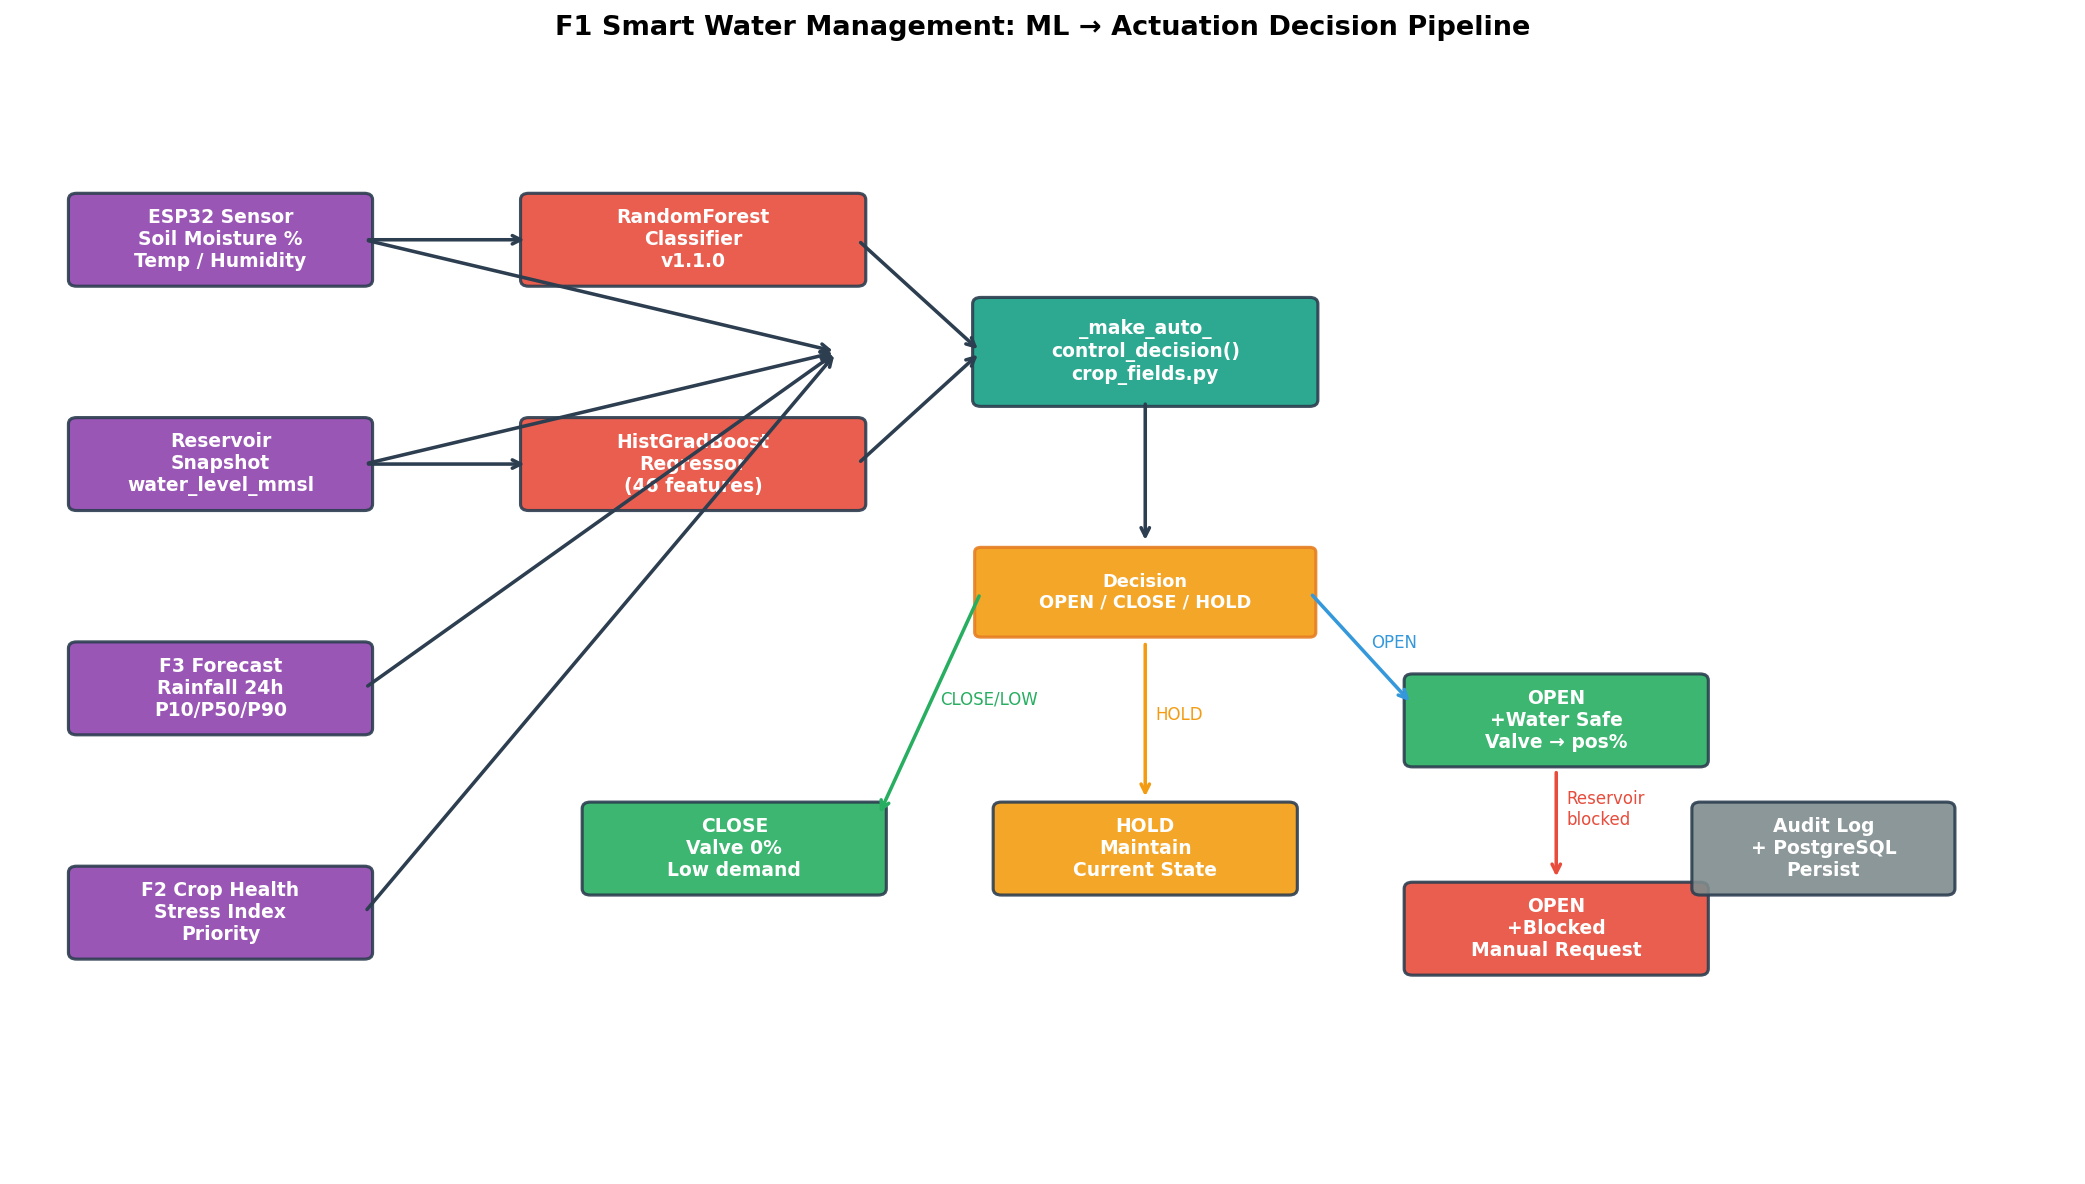
ASICOP uses live soil moisture telemetry and a RandomForestClassifier combined with HistGradientBoosting reservoir release predictions, reducing field-level water waste by 20-35%.
Sri Lankan command-area schemes allocate top-down water quotas before the season. These quotas are highly rigid and cannot adapt to crop changes or weather fluctuations mid-season.
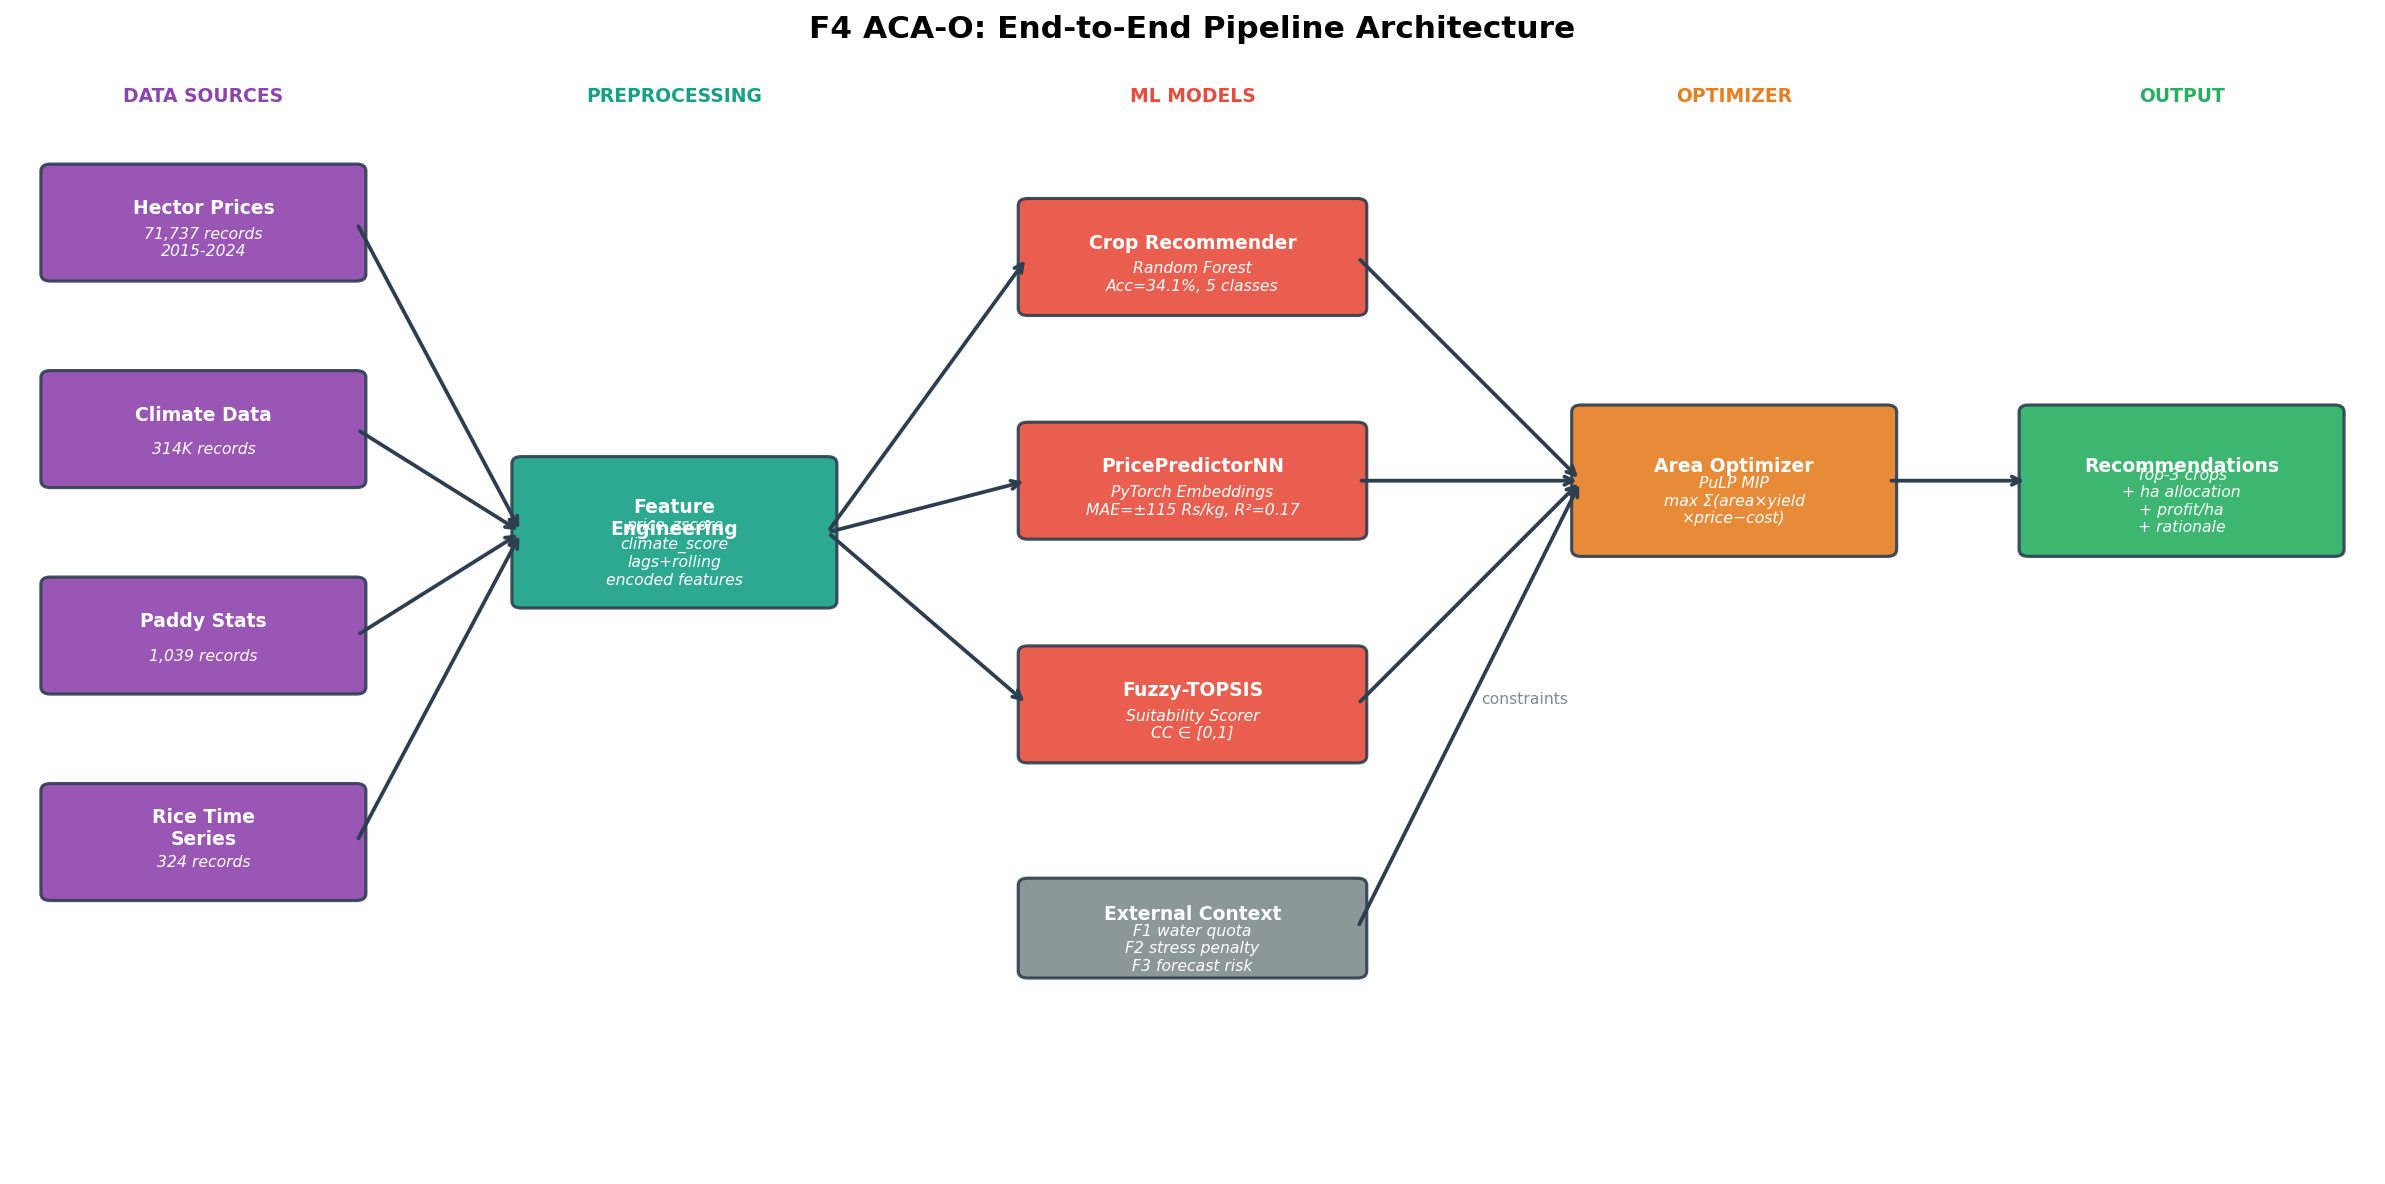
The F4 ACA-O service formulates a mathematical PuLP Mixed-Integer programming model that optimizes crop and area allocation under water limits, and offers Plan B re-planning if quotas change mid-season.
Agronomists and officers manually survey fields to detect stress and disease. By the time visual symptoms are identified, the damage to crop health is often irreversible.
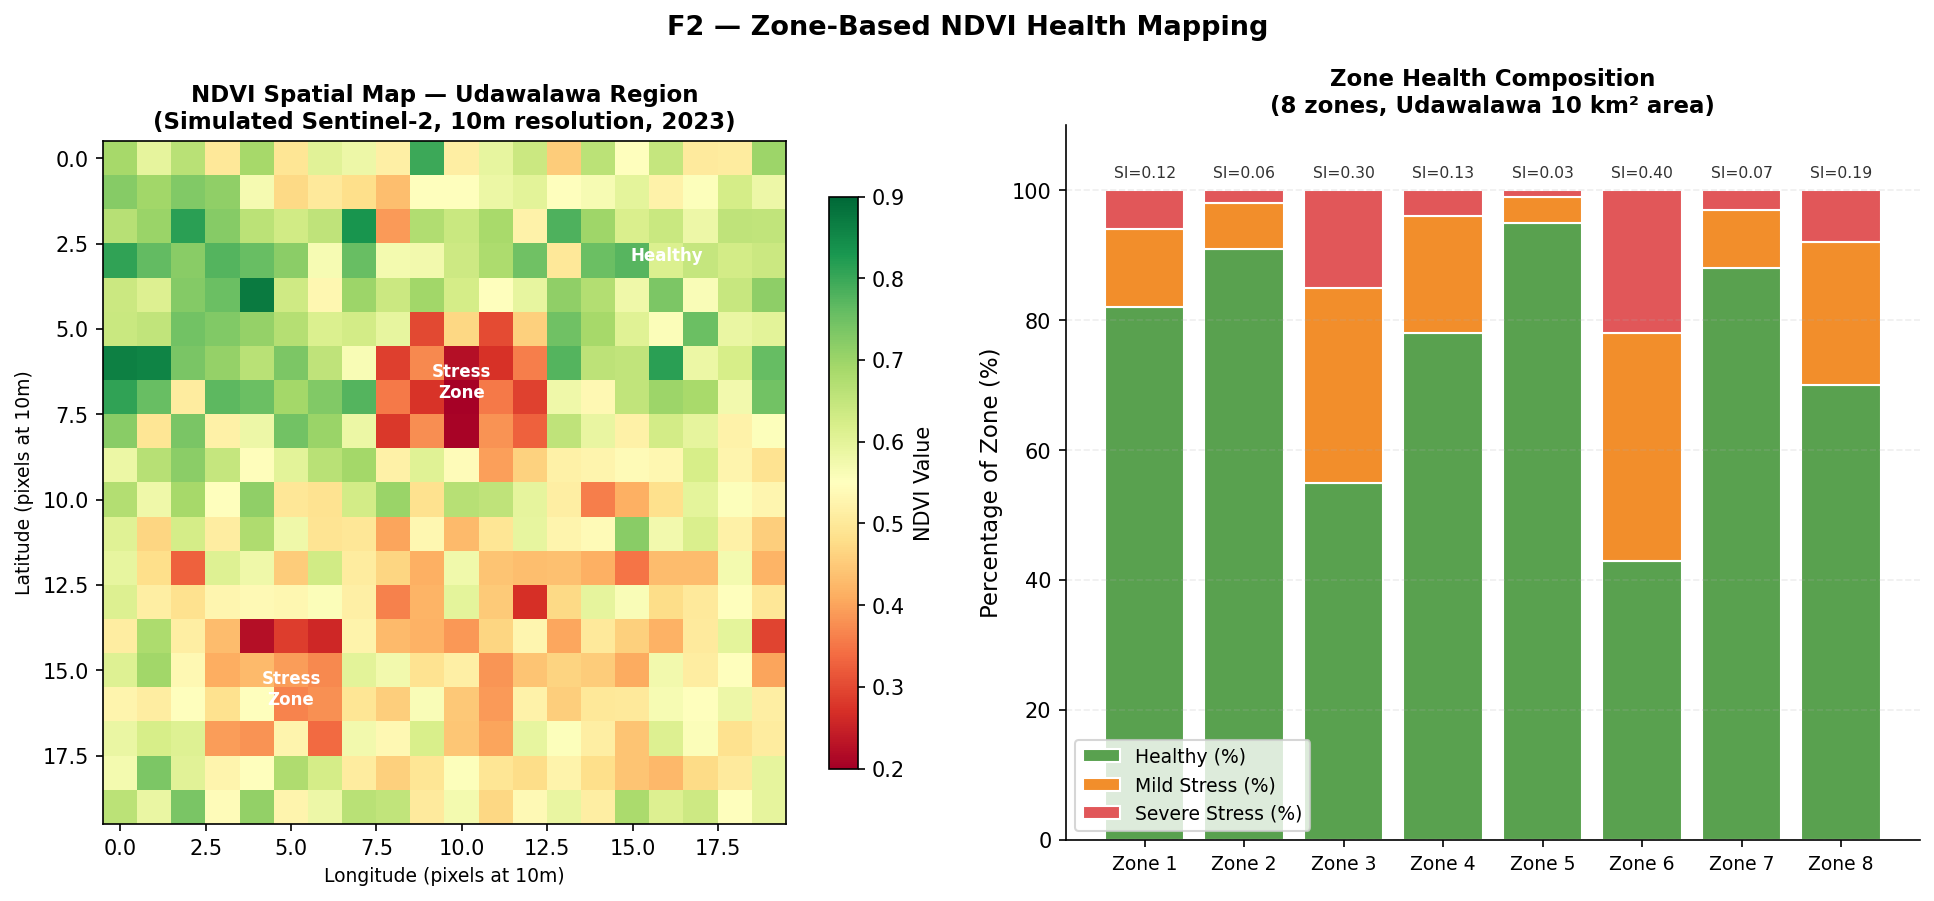
F2 integrates 10m Sentinel-2 satellite indices (NDVI/NDWI) for early zone-level stress detection, and a fine-tuned MobileNetV2 leaf image classifier for instant 38-class edge disease diagnosis.
Farmers decide what crops to cultivate based on current prices, leading to crop gluts and severe market price crashes at harvest time.
F4 runs a LightGBM price predictor trained on 71,737 retail price observations, feeding anticipated farmgate prices into a Fuzzy-TOPSIS scorer to ensure crops are selected for economic viability.
Project Architecture
The platform is more than a dashboard. Each service provides a decision signal that improves another service: stress influences irrigation, forecasts influence optimization, and field telemetry keeps the whole plan grounded.
F1 Irrigation • Hesara
Field telemetry, crop thresholds, reservoir safety gates, and ML predictions are fused into valve actions for quota-based irrigation fields.
F2 Crop Health • Abishek
Remote-sensing zone health and plant image diagnosis identify stress early enough to prioritize irrigation and adjust crop planning.
F3 Forecasting • Trishni
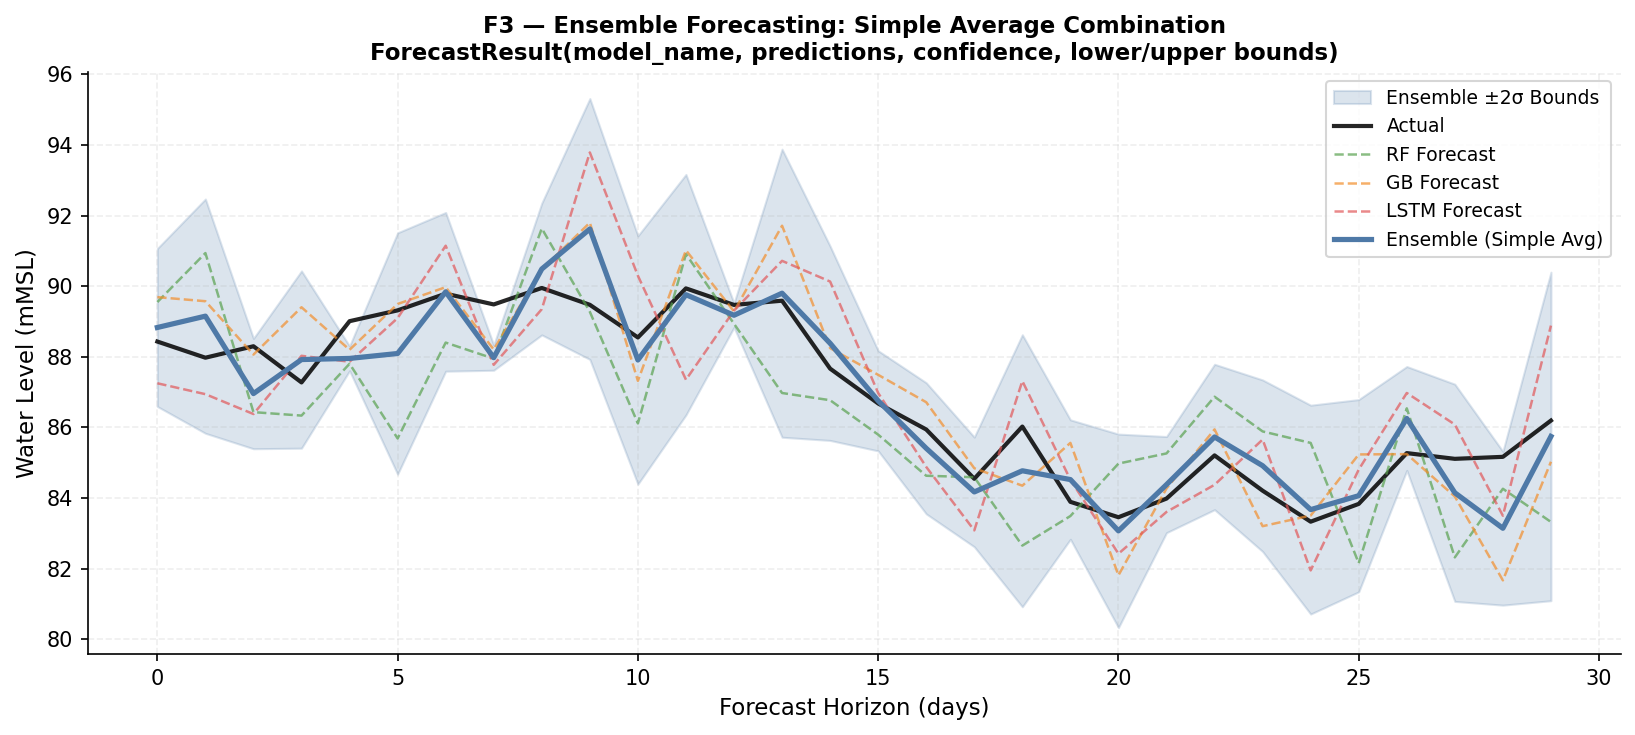
Reservoir and rainfall forecasts expose drought, flood, and uncertainty signals before they affect field schedules or seasonal plans.
F4 ACA-O • Dilruksha
Crop suitability, price signals, water quotas, field stress, and policy rules are combined into practical crop-area recommendations.
Traditional research trains models in isolation. ASICOP connects models at runtime: forecasts alter valve schedules, crop stress penalizes area suitability, and remaining water quotas drive optimization.
Rainfall suppression
Expected rain of ≥5mm within 24h triggers valve closure advice, saving reservoir storage.
Stress priority & suitability penalty
Severe field stress escalates valve priority, while repeated stress acts as a penalty weight in crop suitability planning.
Water budget feedback
Live remaining water quotas act as hard mathematical constraints in the mixed-integer optimization solver.
Algorithm / Method
RandomForest & HistGradientBoosting
Dataset / Scope
31 Years of Udawalawe Hydrology Data
Performance Metric
0.71 MCM Inflow RMSE
Field Impact
20-35% water savings vs static scheduler
Algorithm / Method
MobileNetV2 Transfer Learning & Sentinel-2
Dataset / Scope
54,306 images (38 plant-disease classes)
Performance Metric
95.43% disease classification accuracy
Field Impact
Automated vegetation validation & zone stress map
Algorithm / Method
ARIMA/SARIMA & LSTM Ensembles
Dataset / Scope
1994-2025 Udawalawe level time series
Performance Metric
P10/P50/P90 risk scenarios & alerts
Field Impact
1-14 day lookahead for reservoir/rainfall
Algorithm / Method
Fuzzy-TOPSIS & PuLP MIP Solver
Dataset / Scope
71,737 Hector farmgate price records
Performance Metric
Expected profit vs water budget optimization
Field Impact
Top-3 recommendations & dynamic Plan B updates
Evidence First
The project evidence is grounded in generated research outputs from the repo: hydrology records, NDVI health maps, ensemble forecasts, price modelling, and crop allocation architecture. Click on any diagram below to inspect it in full scale.
F1 - Release prediction
HistGradientBoosting on 2023-2025 test data from the 32-sheet Udawalawe workbook.
F2 - Disease classification
MobileNetV2 transfer learning across 38 PlantVillage crop health classes.
F3 - Best current forecast
Gradient Boosting on the limited 1994 notebook subset; full multi-year training is documented as the fix.
F4 - Price prediction
PricePredictorNN result on Hector-derived crop price data, used as a relative market signal.
Submission Structure
Our complete research logs, timeline milestones, slide decks, and final report drafts have been archived inside structured pages for departmental evaluation.
Integrated project overview and research highlights
Literature, gap, problem, objectives, methodology, and technologies
Assessment timeline with dates and details
Project-wide and individual final submission files
Proposal, progress, final, and stream deep-dive decks
Member profiles, stream ownership, and contact details